Unlocking Market Structure: The Power of the SST Daily Bar Indicator
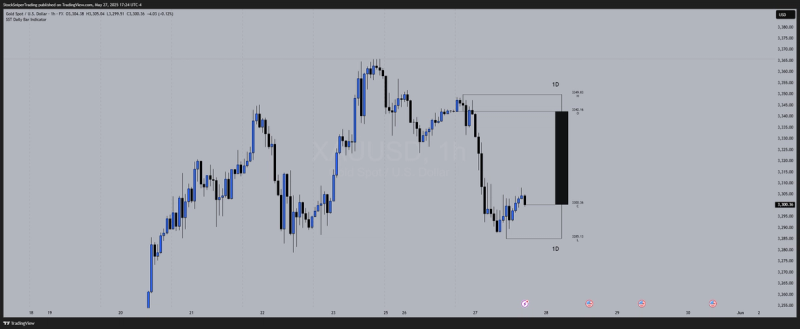
At Stock Sniper Trading, we don’t just trade — we trade with precision. That’s why we created the SST Daily Bar Indicator, a next-level tool designed to give traders an instant visual on higher timeframe price action — directly from any intraday chart.
This indicator doesn’t just show you structure. It shows you where the market is likely to react.
Whether you're trading Gold, NAS100, FX, or Bitcoin, the SST Daily Bar Indicator helps you stay grounded in real-time context — no chart-flipping required.
What is the SST Daily Bar Indicator?

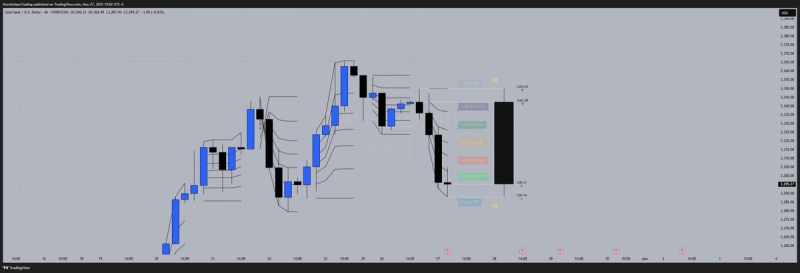
The SST Daily Bar Indicator plots the open, high, low, and close of any selected timeframe (daily, 4H, 1H, etc.) directly on your intraday chart. But what truly sets this tool apart is what’s built inside:
✅ Live Fib Retracement Levels Embedded into the Bar
This means you're not just seeing structure — you're seeing key Fibonacci levels like the 0.236, 0.382, 0.5, 0.618, and 0.786 retracements automatically mapped across the bar in real-time. These levels are essential for identifying pullbacks, rejections, and breakout targets — especially for scalpers and intraday traders.
Why This Changes the Game
1. Timeframe Flexibility
Track the Daily, 4H, 1H (or any timeframe) candle on your 5M, 15M, or 1H charts. This allows you to align low-timeframe trades with higher timeframe context, increasing probability and reducing noise.
2. Built-in Fibonacci Retracements

Other indicators show candles. SST shows reaction zones. With the Fib tool layered right into the structure of the bar, you can anticipate where price may bounce or reverse — no need to draw them manually. This saves time and improves accuracy.
3. Session Awareness & Directional Clarity
By knowing where price is trading relative to the candle open, you gain directional bias. Are we above or below the open? Testing highs or hovering at lows? That’s your edge.
Real Trade Utility
- - Gold scalpers use the 4H bar Fib retracements to catch entries at the 0.618 before NY session reversals.
- - NAS100 day traders track price against the daily bar open and use 0.382–0.5 retracements to enter momentum pullbacks.
- - FX traders overlay the 1H bar on 5M charts to enter with sniper accuracy at confluence zones.
- - Crypto traders stay in control during volatile moves by managing trades around Fib zones within the current 4H bar.
Key Features Recap:
- - Live overlay of Open, High, Low, Close
- - Custom timeframe selection (Daily, 4H, 1H, etc.)
- - Fibonacci retracement levels built in
- - Clean, optimized chart layout
- - Works across all major markets
- - Perfect for scalpers and swing traders alike
Why Our Members Love It
This is more than an indicator — it's a system-enhancing tool that adds structure, discipline, and precision to your intraday workflow. SST traders use it every day to:
- - Mark key zones for entry and exit
- - Avoid taking trades mid-range
- - Align with the real direction of the session
- - Let the higher timeframe guide the lower timeframe setup
Final Thoughts
The SST Daily Bar Indicator is your structural anchor, your bias filter, and your entry guide — all in one. With added Fib retracements and customizable timeframe flexibility, you’re not just watching candles... you’re anticipating price behavior with sniper accuracy.
This is how you stay steps ahead of the market — not by reacting, but by preparing.
Ready to trade like a sniper?
Find the SST Daily Bar Indicator on TradingView now, or connect with our team in Discord for access and live-use training.
Clarity. Structure. Execution. That’s SST.

