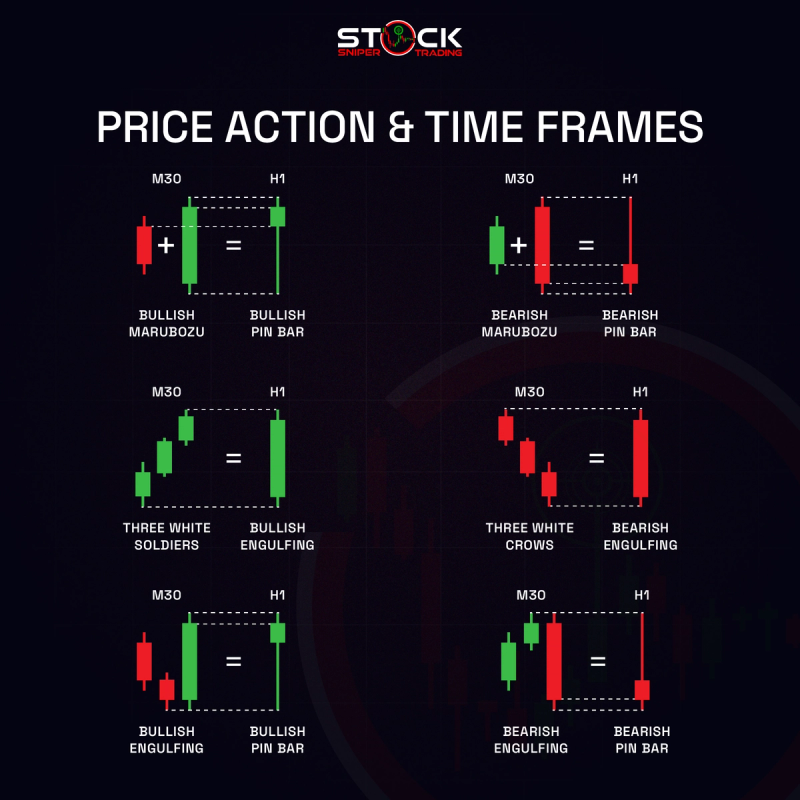
Price Action & Time Frames
Understanding Price Action: Price action trading involves making decisions based on the movements of prices on a chart. It shuns traditional indicators in favor of focusing purely on price changes over time.
Time Frames in Trading: Different time frames can provide varied market perspectives. Shorter time frames, like 30-minute charts, offer insights into immediate price movements, while longer time frames, like hourly charts, provide broader trends.
Example 1: Bullish Marubozu to a Bullish Pin Bar
Bullish Marubozu: This is a strong candlestick pattern indicating buyers' dominance, featuring a long body with little to no wicks. On a 30-minute chart, seeing two consecutive bullish marubozu candlesticks signifies strong upward momentum.
Transition to Bullish Pin Bar: On an hourly chart, these two 30-minute bullish marubozu candles might consolidate into a bullish pin bar. The pin bar signifies a potential reversal, with a longer lower wick indicating a strong rejection of lower prices.
Example 2: Three White Soldiers to Bullish Engulfing
Three White Soldiers: This pattern involves three consecutive bullish candlesticks, reflecting a strong upward trend or reversal from a downtrend. It's often viewed as a sign of continued bullish momentum.
Conversion to Bullish Engulfing: On a larger time frame, these three white soldiers can harmonize into a single bullish engulfing candle. This pattern suggests a strong reversal as the bullish candle completely engulfs the previous bearish candle, indicating renewed buying interest.
Example 3: Bullish Engulfing as a Bullish Pin Bar on Hourly
Bullish Engulfing Pattern: This pattern occurs when a larger bullish candle completely overlaps a previous smaller bearish candle, signaling a potential bullish reversal and increasing buyer strength.
Manifestation as Bullish Pin Bar: On an hourly chart, this bullish engulfing pattern may appear as a pin bar, a candlestick with a small body and a long wick. This reflects market rejection of lower prices and hints at a potential uptrend continuation.
Conclusion
Synergy of Patterns & Time Frames: Understanding how different time frames and patterns interrelate is crucial for effective trading. By analyzing how lower time frame patterns manifest on higher time frames, traders can better gauge market sentiment and potential trend changes.

