Demand Activity & Volume
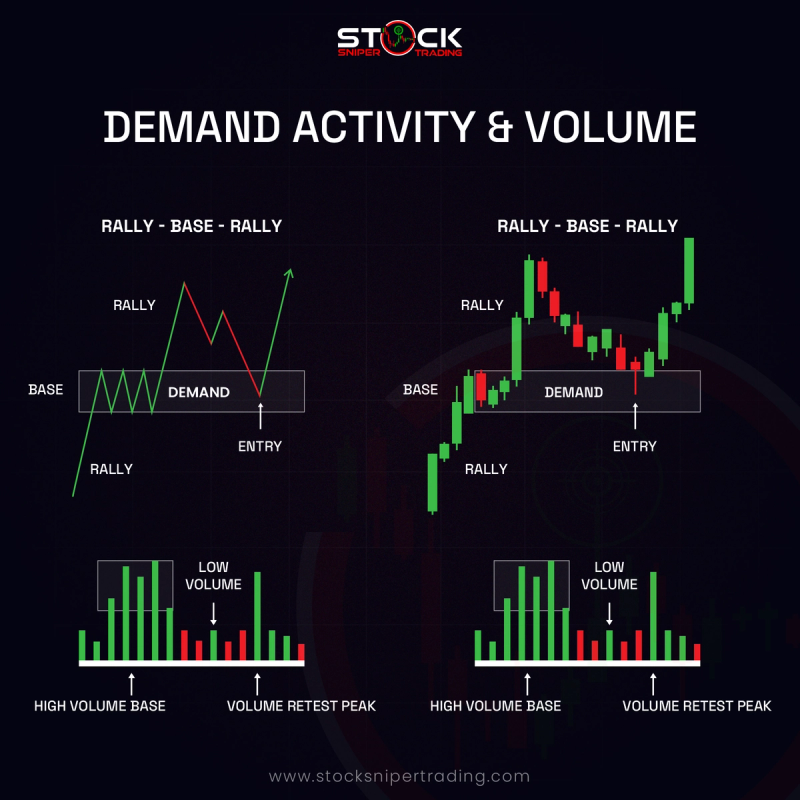
The rally-base-rally (RBR) candlestick pattern indicates strong buying interest, beginning with an upward move, a consolidation phase, and another rally. Analyzing accompanying volume during these phases helps traders identify high-demand areas and potential entry points for informed trading decisions.
Understanding Rally-Base-Rally:
- - Define the rally-base-rally pattern:
- - Rally: A strong upward movement reflecting significant buying interest.
- - Base: A period of consolidation or pause where price remains relatively stable, indicating accumulation.
- - Rally: A continuation of the upward trend as price breaks out from the base.
- - Explain how this pattern is used to identify areas of demand.
Rally-Base-Rally Explained:
- - Identify the three phases of RBR: the initial rally, where price moves significantly upward; the base, characterized by consolidation and minimal price movement; and the subsequent rally, which signals a continuation of the upward trend. This pattern reveals areas of strong buying demand.
Significance of Volume:
- - Analyzing volume during each phase can validate the RBR pattern. Increased volume during rallies often indicates strong buying interest and suggests that the trend is likely to continue.
Identifying RBR Patterns:
- - Learn to spot RBR patterns by looking for a stable base following a strong rally, and subsequent significant price movement. Visual examples can help enhance this understanding, making pattern identification more intuitive.
Trading Strategies:
- - Utilize RBR patterns in trading by identifying entry points during the breakout from the base. Set stop-losses wisely to manage risk, capitalizing on anticipated price movements based on pattern behaviors.
Contextual Analysis:
- - Consider the broader market trend and use additional technical indicators alongside RBR patterns to increase decision-making reliability. This comprehensive approach enhances the accuracy of trade predictions.

