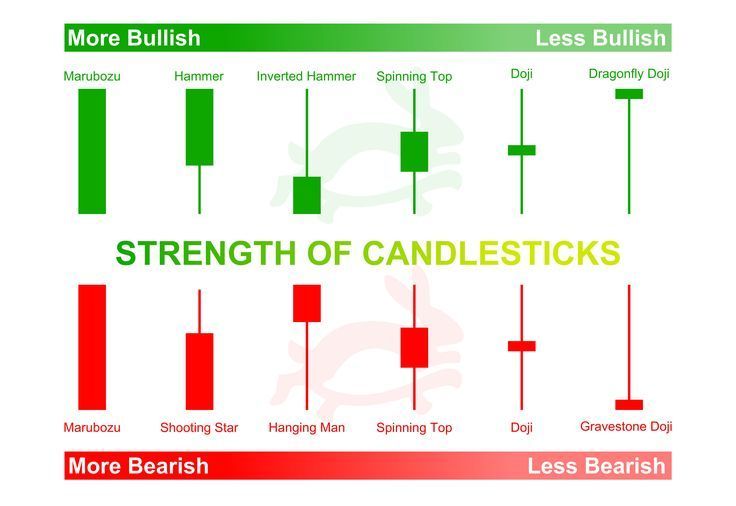
Candlestick charts are a vital tool in technical analysis, providing traders with insights into market sentiment and potential future price movements. The "real body" of a candlestick is the rectangular part that represents the range between the opening and closing prices during a given time period. The color and size of the real body convey important information about market dynamics.
Importance of the Real Body:
1. Indicates Market Direction: The colour of the real body—often green (or blue) for a bullish candle and red (or black) for a bearish candle—shows whether the price closed higher or lower than it opened. A bullish candle suggests buyers have control, while a bearish candle indicates sellers are dominant.
2. Reflects Momentum and Strength: The size of the real body can indicate the strength of the current trend:
- Large Real Body: Suggests strong buying or selling pressure. In an uptrend, a large bullish candle may confirm continuation; in a downtrend, a large bearish candle might suggest further downside.
- Small Real Body: Indicates indecision or weakness in momentum, often seen in doji candlesticks, where open and close prices are very close. This can signal a potential reversal or consolidation.

Size Variations:
- Smaller Bodies:
- Indicate indecision or equilibrium between buyers and sellers.
- Often appear in consolidation phases or near support/resistance levels.
- Can precede a reversal if followed by a larger candle in the opposite direction, forming patterns like spinning tops or dojis.
- Abnormally Large Bodies:
- Reflect significant shifts in market sentiment or noteworthy events.
- May lead to exhaustion after extended trends, indicating potential reversals, especially if volume doesn't support the move.
Point of Control (POC):
The POC in the context of candlesticks refers to areas where buyers or sellers exerted noticeable control, indicated by the size and position of the real body within the candle:
- Bullish Candles: A large lower wick with a long upper wick might indicate initial seller control turned into buyer dominance as the session closed higher.
- Bearish Candles: Conversely, a large upper wick transitioning into a long lower wick signals possible initial buying pressure overtaken by sellers.
Engulfing Candles:
Engulfing patterns are significant due to their implications for reversals:
- Bullish Engulfing: Occurs when a small bearish candle is followed by a larger bullish candle that completely engulfs it. It suggests a strong shift from seller to buyer control, often appearing at the end of a downtrend or near support levels.
- Bearish Engulfing: Features a small bullish candle followed by a larger bearish one, indicating a shift from buying to selling pressure. Typically found at the top of an uptrend or near resistance levels.
Trading Tips on Candle Bodies:
1. Context Matters: Always consider the broader market structure. A large bullish candle within a strong downtrend may not be as significant as one appearing at a support level following a downtrend.
2. Volume Confirmation: Larger bodies should ideally be confirmed by corresponding volume increases. High volume lends credibility to the move, suggesting genuine conviction among traders.
3. Combine with Other Indicators: Use candlestick body analysis alongside other tools like moving averages, RSI, or MACD for enhanced decision-making.
4. Look for Patterns: Recognize patterns involving multiple candles, such as engulfing patterns, inside bars, and harami, to predict potential reversals or continuations.
Understanding the nuances of candlestick bodies enhances a trader's ability to read market conditions and make informed trading decisions.
Join the Sniper Trading Team and take your trading to the next level Stock Sniper Trading

