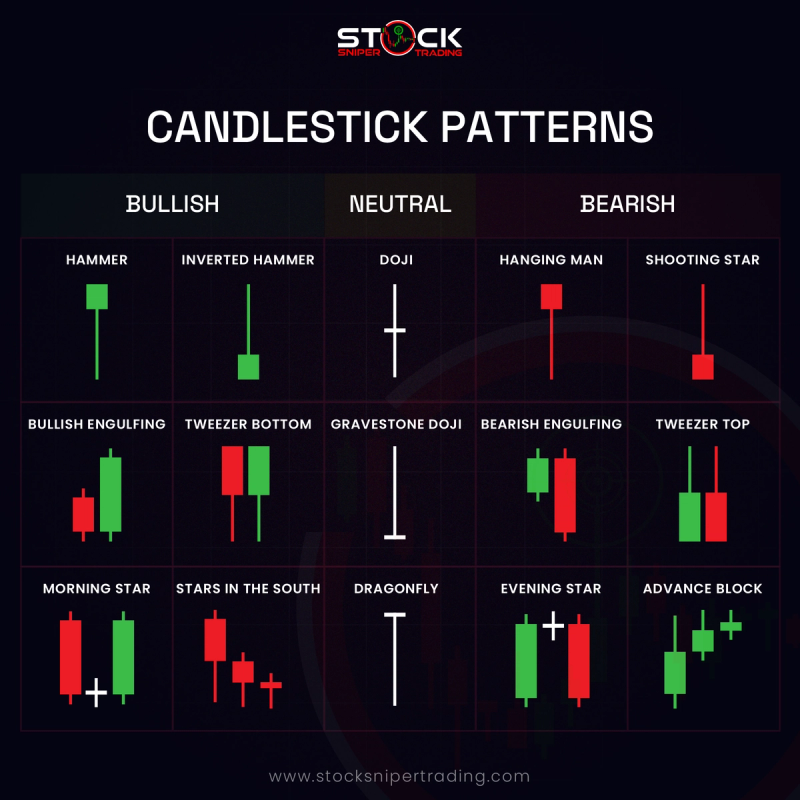
Candlestick Patterns
Bullish Candlesticks: Bullish candlestick patterns signal potential upward movement in the forex market. They often appear at the bottom of a downtrend, indicating a possible reversal. Common examples include the Bullish Engulfing pattern, where a small bearish candle is followed by a larger bullish candle, and the Hammer, characterized by a long lower wick and a short body at the top of the trading range.
Neutral Candlesticks: Neutral candlestick patterns suggest market indecision and can indicate a potential continuation or reversal depending on subsequent market conditions. The Doji is a classic example, where the opening and closing prices are almost equal, resulting in a cross-shaped candle that signifies equilibrium between buyers and sellers.
Bearish Candlesticks: Bearish candlestick patterns suggest potential downward movement and can appear at the peak of an uptrend, hinting at a reversal. Notable patterns include the Bearish Engulfing, where a small bullish candle is engulfed by a larger bearish candle, and the Shooting Star, which shows a small body with a long upper wick, indicating that buyers were overpowered by sellers.
These patterns are instrumental in technical analysis, helping traders anticipate market trends and make informed trading decisions.
Bullish Candlestick Patterns:
- - Hammer Candlestick: Appears at the bottom of a downtrend, featuring a small body and a long lower wick, indicating potential reversal.
- - Inverted Hammer: Similar to the hammer but with a long upper wick, suggesting a possible upside reversal after a downtrend.
- - Bullish Engulfing: Occurs when a small bearish candle is completely engulfed by a larger bullish candle, signaling a potential upward reversal.
- - Tweezer Bottom: Consists of two or more candles with matching lows, indicating a potential reversal of a downtrend.
- - Morning Star: A three-candle pattern suggesting a reversal from a downtrend to an uptrend, usually consisting of a long bearish candle, a short or doji candle, and a long bullish candle.
- - Stars in the South: Less common, it indicates a strong support level with potential upward movement when appearing in a downtrend.
Neutral Candlestick Patterns:
- - Doji: Represents indecision, with opening and closing prices nearly equal, signaling potential reversal or continuation.
- - Gravestone Doji: Indicates potential bearish reversal with a long upper wick and open/close at the low.
- - Dragonfly Doji: Suggests potential bullish reversal with a long lower wick and open/close near the high.
Bearish Candlestick Patterns:
- - Hanging Man: Appears at the top of an uptrend, with a small body and a long lower wick, indicating a potential reversal.
- - Shooting Star: Occurs at the peak of an uptrend featuring a small body and a long upper wick, suggesting a potential downturn.
- - Bearish Engulfing: A small bullish candle is followed by a larger bearish candle that engulfs it, indicating a potential downward reversal.
- - Tweezer Top: Features two or more candles with matching highs, signaling a potential reversal at the end of an uptrend.
- - Evening Star: A three-candle pattern indicating a reversal from an uptrend to a downtrend, usually starting with a bullish candle, followed by a short or doji candle, and ending with a bearish candle.
- - Advance Block: Comprises three consecutive bullish candles, each closing higher but showing weakening momentum, indicating a possible impending reversal.

